Town Centre Health Check April 2025

Data on Erewash's Town, Local, and Village Centres.

Town Centre Health Check

Town Centre Health Check

Introduction

Since 2018, Erewash Borough Council has produced an annual health check document regarding its two town centres; Long Eaton and Ilkeston, and its two local centres; Borrowash and Sandiacre. Since January 2023 four village centres have been included, in keeping with the draft Local Plan produced by Erewash Borough Council in 2022. These centres are: Breaston, Draycott, Little Eaton, and West Hallam.

These reports help provide the Council with information on planning use class, business category, business type, first/second floor use, and vacancy rates. Regular, 6 monthly, updates help to ensure effective monitoring of the Borough’s centres and reveal any patterns of change. The information in this document is based on the latest monitoring conducted during April 2025.

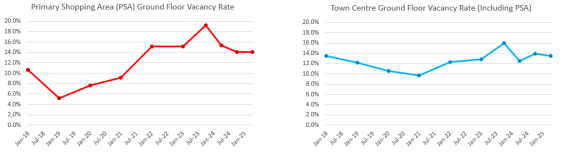
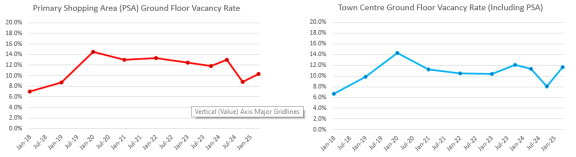
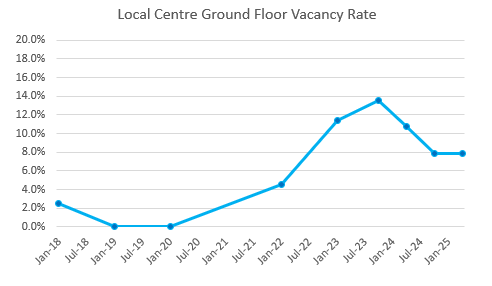
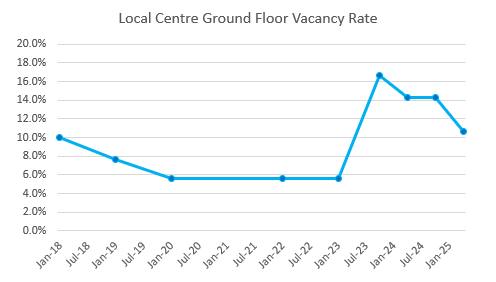
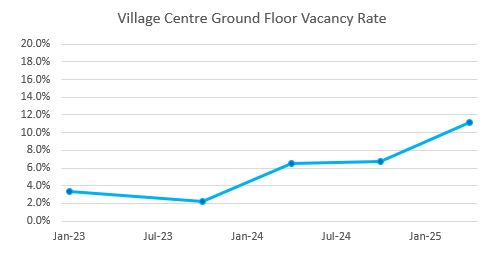
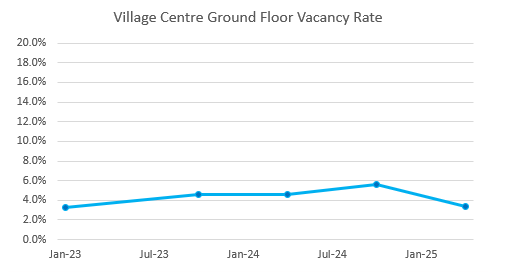
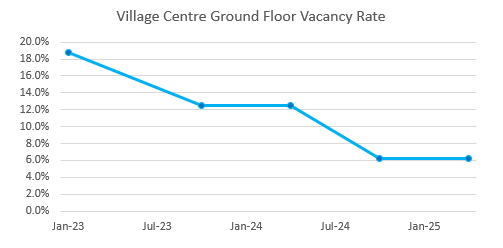
The Council is now able to compare this report’s data with Oct 2018 –October 2024’s data for vacancy rates. Since October 2024 Long Eaton has seen an increased vacancy rate in both its Primary Shopping Area (PSA) and it’s wider Town Centre. Breaston has also seen an increase in vacancy. Vacancy has declined in Sandiacre, Draycott, and in Ilkeston’s Town Centre. Vacancy in Ilkeston’s PSA has not changed, and the vacancy rate in Little Eaton and West Hallam has also remained constant.

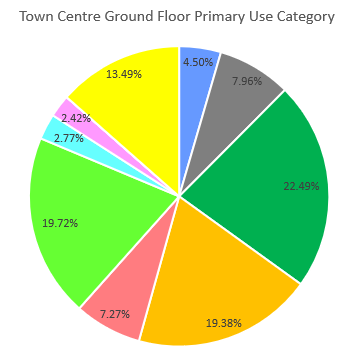
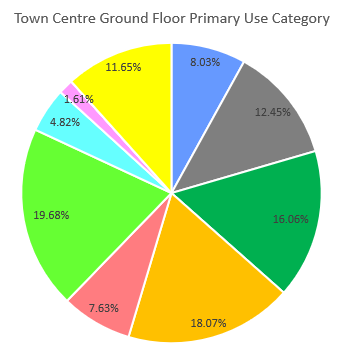
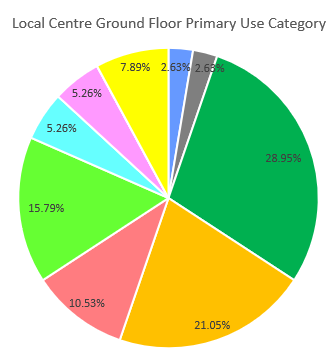
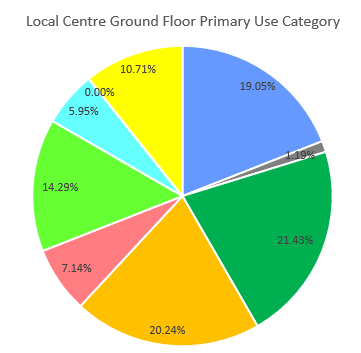
This webpage provides an abridged summary of the April 2025 Health Check, featuring overall and, where they exist, Primary Shopping Area vacancy rates as well as first floor use class breakdowns. The full April 2025 Health Check can be downloaded at the bottom of this page, it includes vacancy rates and first/second floor use class breakdowns for each of the Centres. It also includes historic use class change date and detailed business type breakdowns for both Town Centres.

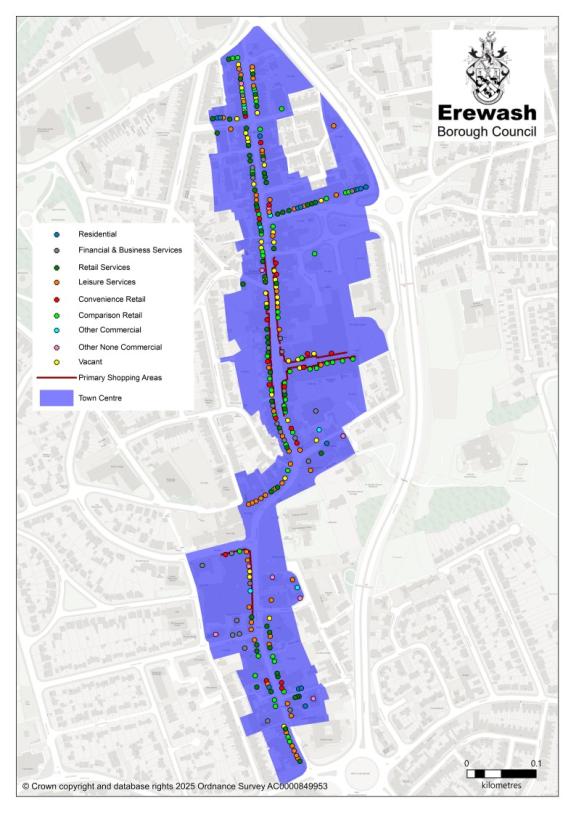
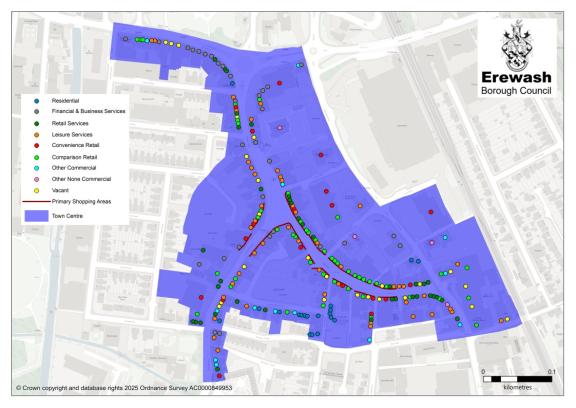
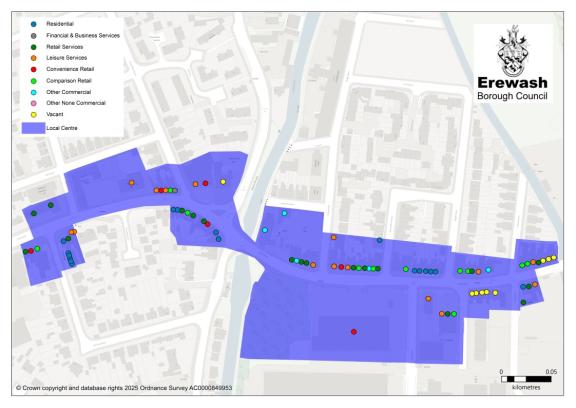
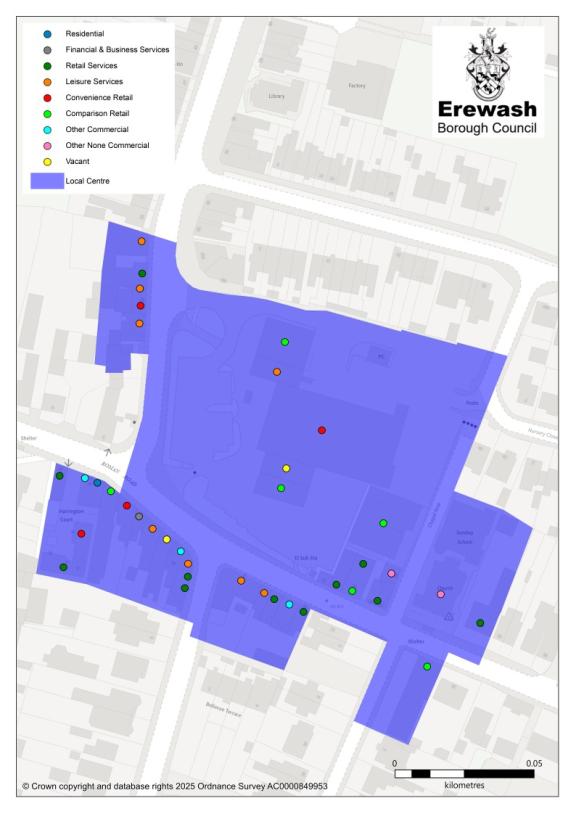
Maps showing the PSAs and Town/Local Centre boundaries annotated with coloured dots representing units and their use can be found in the appendix. 

Ilkeston Town Centre
Two line graphs. The left graph shows how the vacancy rate in Ilkeston's Primary Shopping Area (PSA) has changed since January 2018, the data represented in this line graph can be found in the first table below. The right Graph shows how the vacancy rate in Ilkeston's whole Town Centre (including the PSA) has changed since January 2018, the data represented in this line graph can be found in the second table below.
PSA  Jan-18 Jan-19 Jan-20 Jan-21 Jan-22 Jan-23 Oct-23 Apr-24 Oct-24 Apr-25
Vacancy Rate 10.7% 5.2% 7.7% 9.1% 15.2% 15.2% 19.2% 15.4% 14.1% 14.1%
Total Units 75 77 78 77 79 79 78 78 78 78
Vacant Units 8 4 6 7 12 12 15 12 11 11
Town Centre  Jan-18 Jan-19 Jan-20 Jan-21 Jan-22 Jan-23 Oct-23 Apr-24 Oct-24 Apr-25
Vacancy Rate 13.5% 12.2% 10.6% 9.7% 12.3% 12.8% 16.0% 12.5% 13.9% 13.5%
Total Units 297 304 303 300 293 296 288 289 287 289
Vacant Units 40 37 32 29 36 38 46 36 40 39
A pie chart showing the percentage of units in Ilkeston's Town Centre that are occupied by a particular use class, as of April 2025. The data represented in this pie chart can be found in the table below.
Use Category Number of Units % of Units
Residential 13 4.50%
Financial & Business
Services
23 7.96%
Retail Service 65 22.49%
Leisure Service 56 19.38%
Convenience Retail 21 7.27%
Comparison Retail 57 19.72%
Other Commercial 8 2.77%
Other Non-commercial 7 2.42%
Unknown 0 0.00%
Vacant 39 13.49%
Total 289 100.00%

Long Eaton Town Centre
Two line graphs. The left graph shows how the vacancy rate in Long Eaton's Primary Shopping Area (PSA) has changed since January 2018, the data represented in this line graph can be found in the first table below. The right Graph shows how the vacancy rate in Long Eaton's whole Town Centre (including the PSA) has changed since January 2018, the data represented in this line graph can be found in the second table below
PSA  Jan-18 Jan-19 Jan-20 Jan-21 Jan-22 Jan-23 Oct-23 Apr-24 Oct-24 Apr-25
Vacancy Rate 7.0% 8.7% 14.5% 13.0% 13.3% 12.5% 11.8% 13.0% 8.8% 10.3%
Total Units 71 69 69 69 75 72 68 69 68 68
Vacant Units 5 6 10 9 10 9 8 9 6 7
Town Centre  Jan-18 Jan-19 Jan-20 Jan-21 Jan-22 Jan-23 Oct-23 Apr-24 Oct-24 Apr-25
Vacancy Rate 6.7% 9.9% 14.3% 11.2% 10.5% 10.4% 12.1% 11.3% 8.1% 11.7%
Total Units 253 252 252 251 258 258 248 248 248 249
Vacant Units 17 25 36 28 27 20 30 28 20 29
A pie chart showing the percentage of units in Long Eaton's Town Centre that are occupied by a particular use class, as of April 2025. The data represented in this pie chart can be found in the table below.
Use Category Number of Units % of Units
Residential 20 8.03%
Financial & Business
Services
31 12.45%
Retail Service 40 16.06%
Leisure Service 45 18.07%
Convenience Retail 19 7.63%
Comparison Retail 49 19.68%
Other Commercial 12 4.82%
Other Non-commercial 4 1.61%
Unknown 0 0.00%
Vacant 29 11.65%
Total 249 100.00%

Borrowash Local Centre
A line graph showing how the vacancy rate in Borrowash's Local Centre has changed since January 2018, the data represented in this line graph can be found in the table below.
Local Centre Jan-18 Jan-19 Jan-20 Jan-22 Jan-23 Oct-23 Apr-24 Oct-24 Apr-25
Vacancy Rate 2.5% 0.0% 0.0% 4.5% 11.4% 13.5% 10.8% 7.9% 7.9%
Total Units 40 42 41 44 44 37 37 38 38
Vacant Units 1 0 0 2 5 5 4 3 3
A pie chart showing the percentage of units in Borrowash's Local Centre that are occupied by a particular use class, as of April 2025. The data represented in this pie chart can be found in the table below
Use Category Number of Units % of Units
Residential 1 2.63%
Financial & Business
Services
1 2.63%
Retail Service 11 28.95%
Leisure Service 8 21.05%
Convenience Retail 4 10.53%
Comparison Retail 6 15.79%
Other Commercial 2 5.26%
Other Non-commercial 2 5.26%
Unknown 0 0.00%
Vacant 3 7.89%
Total 38 100.00%

Sandiacre Local Centre
A line graph showing how the vacancy rate in Sandiacre's Local Centre has changed since January 2018, the data represented in this line graph can be found in the table below.
Local Centre Jan-18 Jan-19 Jan-20 Jan-22 Jan-23 Oct-23 Apr-24 Oct-24 Apr-25
Vacancy Rate 10.0% 7.7% 5.6% 5.6% 5.6% 16.7% 14.3% 14.3% 10.7%
Total Units 40 42 41 44 44 37 37 38 38
Vacant Units 9 7 5 5 5 14 12 12 9
A pie chart showing the percentage of units in Sandiacre's Local Centre that are occupied by a particular use class, as of April 2025. The data represented in this pie chart can be found in the table below.
Use Category Number of Units % of Units
Residential 16 19.05%
Financial & Business
Services
1 1.19%
Retail Service 18 21.43%
Leisure Service 17 20.24%
Convenience Retail 6 7.14%
Comparison Retail 12 14.29%
Other Commercial 5 5.95%
Other Non-commercial 0 0.00%
Unknown 0 0.00%
Vacant 9 10.71%
Total 84 100.00%

Breaston Village Centre
A line graph showing how the vacancy rate in Breaston's Village Centre has changed since January 2018, the data represented in this line graph can be found in the table below.
Village Centre Jan-23 Oct-23 Apr-24 Oct-24 Apr-25
Vacancy Rate 3.3% 2.2% 6.5% 6.7% 11.1%
Total Units 42 46 46 45 45
Vacant Units 2 1 3 3 5


A pie chart showing the percentage of units in Breaston's Village Centre that are occupied by a particular use class, as of April 2025. The data represented in this pie chart can be found in the table below.
Use Category Number of Units % of Units
Residential 14 31.11%
Financial & Business
Services
1 2.22%
Retail Service 8 17.78%
Leisure Service 7 15.56%
Convenience Retail 3 6.67%
Comparison Retail 2 4.44%
Other Commercial 2 4.44%
Other Non-commercial 3 6.67%
Unknown 0 0.00%
Vacant 5 11.11%
Total 45 100.00%

Draycott Village Centre
A line graph showing how the vacancy rate in Draycott's Village Centre has changed since January 2018, the data represented in this line graph can be found in the table below.
Village Centre Jan-23 Oct-23 Apr-24 Oct-24 Apr-25
Vacancy Rate 3.3% 4.6% 4.6% 5.6% 3.4%
Total Units 90 88 88 89 89
Vacant Units 3 4 4 5 3


A pie chart showing the percentage of units in Draycott's Village Centre that are occupied by a particular use class, as of April 2025. The data represented in this pie chart can be found in the table below.
Use Category Number of Units % of Units
Residential 48 53.93%
Financial & Business
Services
1 1.12%
Retail Service 11 12.36%
Leisure Service 11 12.36%
Convenience Retail 5 5.62%
Comparison Retail 5 5.62%
Other Commercial 3 3.37%
Other Non-commercial 2 2.25%
Unknown 0 0.00%
Vacant 3 3.37%
Total 89 100.00%

Little Eaton Village Centre
Village Centre Jan-23 Oct-23 Apr-24 Oct-24 Apr-25
Vacancy Rate 0.0% 0.0% 0.0% 0.0% 0.0%
Total Units 27 24 24 24 24
Vacant Units 0 0 0 0 0


A pie chart showing the percentage of units in Draycott's Village Centre that are occupied by a particular use class, as of April 2025. The data represented in this pie chart can be found in the table below.
Use Category Number of Units % of Units
Residential 1 4.17%
Financial & Business
Services
0 0.00%
Retail Service 6 25.00%
Leisure Service 4 16.67%
Convenience Retail 2 8.33%
Comparison Retail 1 4.17%
Other Commercial 9 37.50%
Other Non-commercial 1 4.17%
Unknown 0 0.00%
Vacant 0 0.00%
Total 24 100.00%

West Hallam Village Centre
A line graph showing how the vacancy rate in West Hallam's Village Centre has changed since January 2018, the data represented in this line graph can be found in the table below.
Village Centre Jan-23 Oct-23 Apr-24 Oct-24 Apr-25
Vacancy Rate 18.8% 12.5% 12.5% 6.3% 6.3%
Total Units 16 16 16 16 16
Vacant Units 3 2 2 1 1


A pie chart showing the percentage of units in West Hallam's Village Centre that are occupied by a particular use class, as of April 2025. The data represented in this pie chart can be found in the table below.
Use Category Number of Units % of Units
Residential 2 12.50%
Financial & Business
Services
1 6.25%
Retail Service 4 25.00
Leisure Service 3 18.75%
Convenience Retail 1 6.25%
Comparison Retail 1 6.25%
Other Commercial 1 6.25%
Other Non-commercial 2 12.50%
Unknown 0 0.00%
Vacant 1 6.25%
Total 16 100.00%

Appendix: Annotated Boundary Maps

Ilkeston

A map showing the boundary of Ilkeston Town Centre with coloured dots representing the type of business that occupies each unit.

Long Eaton

A map showing the boundary of Long Eaton Town Centre with coloured dots representing the type of business that occupies each unit.

Sandiacre

A map showing the boundary of Sandiacre Local Centre with coloured dots representing the type of business that occupies each unit.

Borrowash

 A map showing the boundary of Borrowash Local Centre with coloured dots representing the type of business that occupies each unit.
Town Centre Health Check full document download.

A-Z of services

A B C D E F G H I J K L M N O P Q R S T U V W X Y Z